
The Buggy Lab (09/12/2021)
Curtis Zhou, Ryan Rong, Ibrahim Khan and James O'Neill
Research Question
How does time affect the position of the buggy?
In this lab:
The independent variable is time, in seconds.
The dependent variable is the final position of the buggy, in centimeters.
The independent variable is time, in seconds.
The dependent variable is the final position of the buggy, in centimeters.
Control variables
- The same starting position: hover the front of the buggy at position zero in every trial.
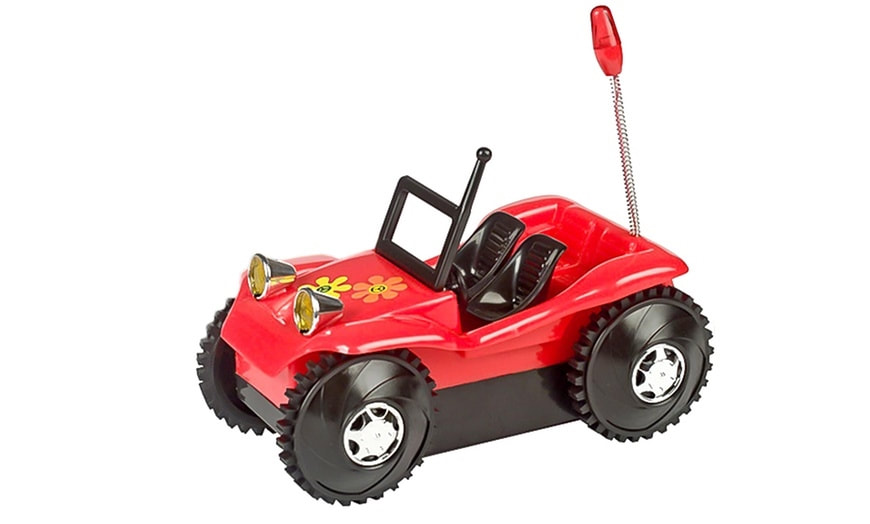
- The same buggy: use the same buggy throughout the whole experiment.
Collection of data
We used a smartphone timer to set certain durations that the buggy would traverse for. We also used 2 meter sticks joined end-to-end to measure the final position of the buggy on the floor.
Lab setup
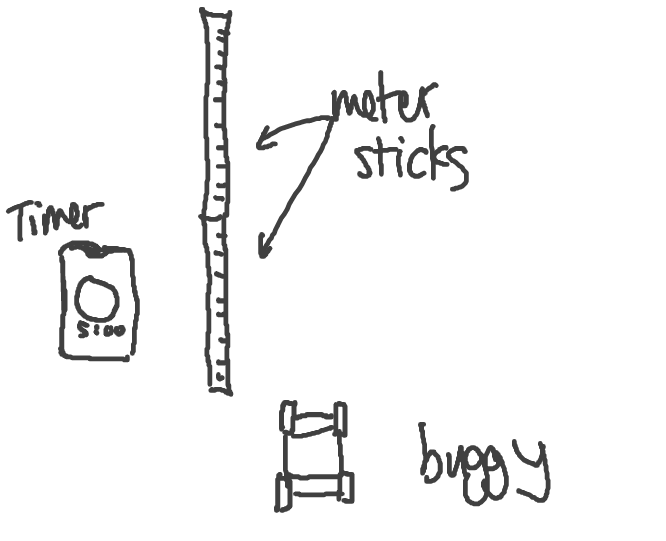
(Figure 1)
The lab setup is simple, we had 2 meter sticks joined end-to-end on the floor. We made sure that the 2 meter sticks were parallel to each other to make sure the measurements are accurate. Other objects used in this lab are the buggy and a smartphone timer.
Procedure
- Turn on the buggy and hover the front of it at a position of zero centimeters.
- Drop the buggy on the floor while starting the timer on the smartphone.
- Pick up the buggy when the time is up and measure the final position of the buggy by using the meter stick on the left.
We measured 5 time intervals of 1 second, 2 seconds, 5 seconds, 10 seconds and 15 seconds, with 3 trials for each interval.
Raw Data
Time (seconds) |
1 |
2 |
5 |
10 |
15 |
Trial 1 (final position, cm) |
15 |
30 |
71 |
115 |
185 |
Trial 2 (final position, cm) |
14 |
29 |
70 |
124 |
182 |
Trial 3 (final position, cm) |
14 |
26 |
75 |
113 |
194 |
(Figure 2)
Processed Raw Data
Time (seconds) |
Average Position (cm) |
1 |
14.33 |
2 |
28.33 |
5 |
71.66 |
10 |
117.66 |
15 |
187 |
(Figure 3)
Data is processed by taking the average of each trial, yielding the average position of each time interval. This is calculated by the equation below:
Average Position = (Trial 1 + Trial 2 + Trial 3) /3
Graph
| buggy.cmbl |
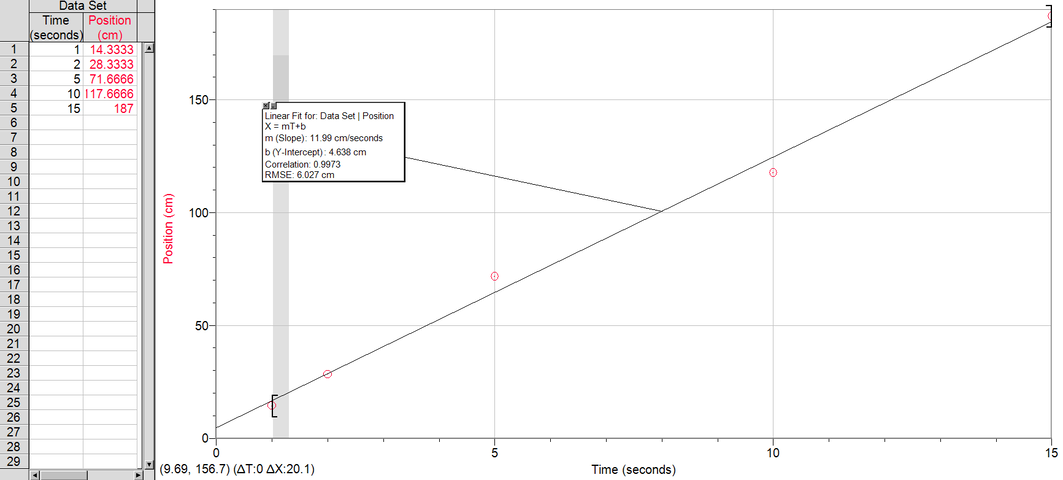
(Figure 3)
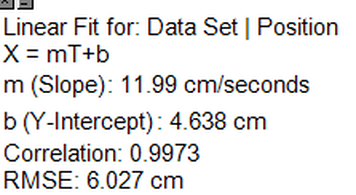
(Figure 4)
Figure 3 shows the graph, along with the line of best fit, of the data processed. In figure 4, the slope of the line of best fit represents the velocity of the buggy that best fits the data points collected. The y-intercept represents the starting position of the buggy that fits the data collected.
Purpose
The purpose of this lab is to calculate the velocity of the buggy. The slope of the graph calculated by logger pro is the velocity of the buggy (in cm/s) that best fits the data. The process described in this lab can also be generalized to calculate the velocity of other moving objects travelling at a constant speed.
Conclusion
The estimated velocity of the buggy is 11.99 cm/s, with a starting position of 4.638 cm. The equation
x = 11.99t+4.638 represents the movement of the buggy. This means that for every 1 second that passes, the buggy travels 11.99 centimeters.
x = 11.99t+4.638 represents the movement of the buggy. This means that for every 1 second that passes, the buggy travels 11.99 centimeters.
Evaluation
One uncertainty of the lab is the time. The time we started the timer (and dropped the buggy) and the time we stopped the timer (and picked the buggy up) might not be precise. The timing could be off by a few milliseconds. A second uncertainty of the lab is the measurement of the final position. When we pick the buggy up we could have moved it forwards or backwards, leading to a slightly inaccurate reading of the position measurement. A third uncertainty is the fact that the meter stick only has tick marks of 1cm: an innate weakness of the lab. This limits the measurement to be only certain to centimeters. A fourth uncertainty is the starting position of the buggy. We could have placed the buggy down at different positions in each trial, leading to a slight error of the final position. These uncertainties explain why there are some outliers in trial 2 of the time interval of 10 seconds and trial 3 of the time interval of 15 seconds, as well as how the y-intercept of the line of best fit (which is also the starting position of the buggy) is 4.638 cm instead of zero.
Improvements
One improvement to this lab is to use a motion sensor that can accurately measure the position of the buggy along with the precise time intervals. This will avoid most human errors made in this lab.
