
Cart on Ramp Lab (09/23/2021)
Jongwoo Park, Ryan Rong, Grace Cheung and James O'Neill
Research Question
How does time affect the position of the cart?
In this lab:
The independent variable is time, in seconds.
The dependent variable is the final position of the cart, in centimeters.
The independent variable is time, in seconds.
The dependent variable is the final position of the cart, in centimeters.
Control variables
- The same slope of the ramp. Different slopes can affect the acceleration of the cart so we have to keep it controlled.
- The same cart throughout the experiment.
Collection of data
We used a smartphone to record a video of the motion of the cart going down the ramp. Then we used the video analysis software in Logger Pro to collect and analyze our data.
Lab setup
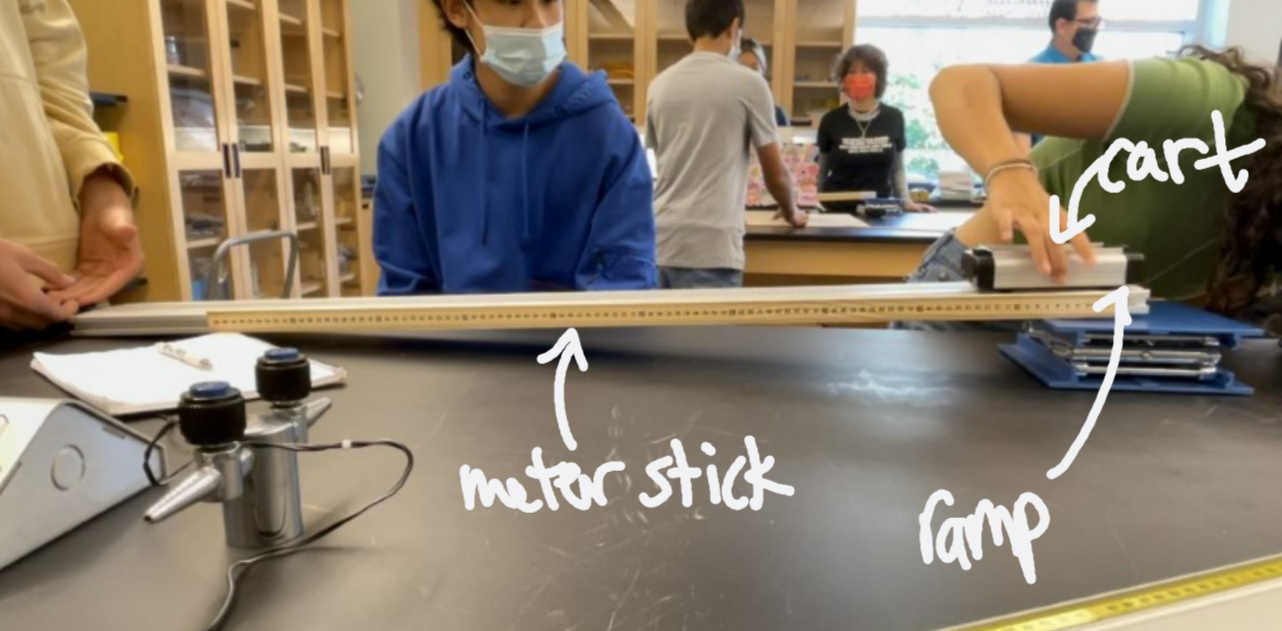
(Figure 1)
We have a fixed smartphone camera recording the setup above: a ramp positioned at the center and a meter stick right next to it.
Procedure
Procedure for taking the video:
- Start the video
- Hover the cart over the ramp and let go
- Stop the video
- Set the origin to the front of the cart to the and adjust the axis to fit the motion of the cart
- Use the meter stick inside the video and set it as reference for one meter
- Click on the front on the cart every frame to record the data.
- Insert graph to visualize the data points.
Raw Data
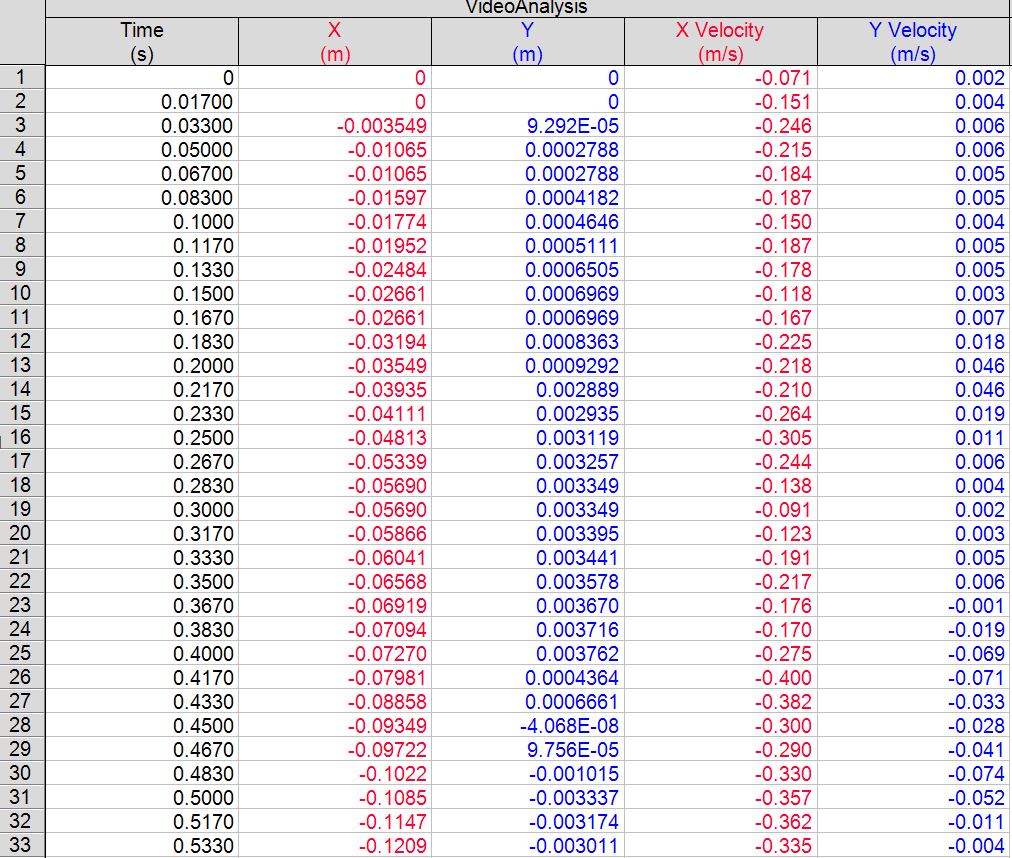
(Figure 2)
Only the first 33 rows are shown, you can download the complete data with the graphs below
| buggyslope.cmbl |
Graphs
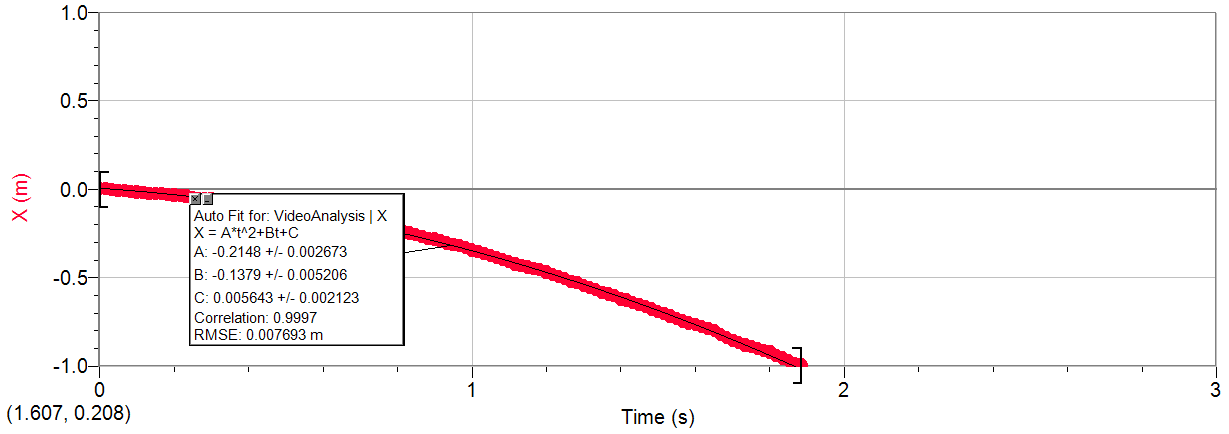
(Figure 3)
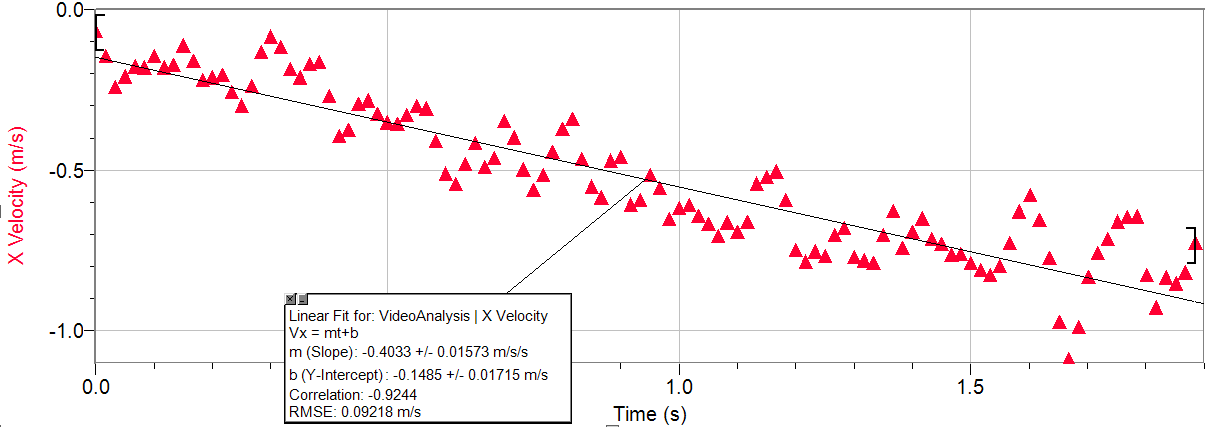
(Figure 4)
Figure 3 shows the graph of the position of the cart over time. The y-intercept is zero, which is the starting position of the cart. The slope of the graph is negative and continues to get steeper over time, indicating a speeding up in the negative direction of the cart. Figure 4 shows the graph of the velocity of the cart over time. The y-intercept is zero, suggesting the cart is at rest before going down the ramp. The slope of the graph is negative, indicating a negative acceleration over time of the cart.
Purpose
The purpose of this lab is to calculate the acceleration of the cart. The slope of the velocity time graph (figure 4) calculated by logger pro is the acceleration of the cart (in cm/s/s) that best fits the data. The process described in this lab can also be generalized to calculate the acceleration of other moving objects.
Conclusion
The estimated acceleration of the cart is -0.4033 cm/s/s. The equation X = -0.2148t^2-0.1379t+0.0056 represents the position of the cart while the equation X velocity = -0.4033t-0.1485 represents the velocity of the cart. This means that for every 1 second that passes, the velocity of the cart changes by around -0.4 cm/s/s. Since the cart is travelling in a negative direction with a negative acceleration, the cart is speeding up by around 0.4 cm/s/s every second.
Evaluation
An uncertainty of the lab is the position of the cart. In our method of collecting data, we had to manually plot the point that represents the position of the cart each frame. The points we plotted can be a few centimeters off from the actual position of the cart. The motion blur in the video also obscures the actual position of the cart, making the data collected less accurate. This inaccuracy explains why the initial position and initial velocity are both a bit off from zero.
Improvements
One improvement to this lab might be to use a better camera with better frame rate to avoid the problem of motion blur. We can also just be more meticulous with our manual placement of the data points.
